RedZone table
See below a full list of the RedZone funds:
| 3 year % growth | Quartile position | |
| Asia Pacific Excluding Japan | ||
| Aberdeen Asia Pacific Equity | 24.50 | 4 |
| Aberdeen Global Asia Pacific Equity | 24.13 | 4 |
| CF Canlife Asia Pacific | 12.81 | 4 |
| Henderson Asia Pacific Capital Growth | 31.53 | 3 |
| Henderson Asian Dividend Income | 32.06 | 3 |
| Legg Mason Martin Currie Asia Long Term Unconstrained | 24.84 | 4 |
| Natixis Emerise Pacific RIM Equity | 16.87 | 4 |
| New Capital Asia Pacific Equity Income | -7.55 | 4 |
| Newton Oriental | 22.68 | 4 |
| Principal GIF Asian Equity | 27.95 | 4 |
| Sector average | 33.58 | |
| Asia Pacific Including Japan | ||
| GAM Star Asia Pacific Equity | 32.38 | 4 |
| Sector average | 37.98 | |
| China/Greater China | ||
| Baring China Select | 29.11 | 3 |
| JPM Hong Kong | 21.74 | 4 |
| Neptune China | 13.25 | 4 |
| Sector average | 30.04 | |
| Europe Excluding UK | ||
| Legg Mason IF Martin Currie European Equity Income | 18.07 | 4 |
| MFS Meridian Continental European Equity | 10.34 | 4 |
| Sanlam FOUR Active European Ex-UK Equity | 11.37 | 4 |
| Standard Life Investments European Equity Growth | 23.68 | 4 |
| Standard Life Investments European Ethical Equity | 21.90 | 4 |
| Sector average | 27.03 |
|
| Europe Including UK | ||
| Virgin Climate Change | 2.61 | 4 |
| Sector average | 23.14 |
|
| Flexible Investment | ||
| CF Ruffer Equity & General | 9.89 | 4 |
| HC KB Capital Growth | 15.73 | 4 |
| MI Momentum Factor 3 | 15.05 | 4 |
| MI Momentum Factor 4 | 20.83 | 3 |
| S&W Starhunter Managed | 18.78 | 4 |
| Scottish Widows HIFML Dynamic Return | 6.34 | 4 |
| Thesis Balanced Growth | 18.22 | 4 |
| Sector average | 21.77 |
|
| Global | ||
| BlackRock NURS II Global Equity | 35.06 | 3 |
| Carmagnac Investissement | 16.97 | 4 |
| Dominion Global Trends Managed GBP | 22.73 | 4 |
| FP Matterley UK & International Growth | 30.44 | 4 |
| Guinness Alternative Energy | -13.28 | 4 |
| Henderson Multi-Manager Global Select | 23.14 | 4 |
| JB EF Luxury Brands | 11.88 | 4 |
| JGF-Jupiter Global Ecology Growth | 26.75 | 4 |
| Marlborough Global | 38.93 | 3 |
| MFS Meridian Global Energy | -7.96 | 4 |
| MI Thornbridge Global Opportunities | 28.54 | 4 |
| Natixis Harris Associates Global Equity | 30.01 | 4 |
| Neptune Global Equity | 22.61 | 4 |
| Old Mutual Global Best Ideas | 25.41 | 4 |
| Royal Bank of Scot International Growth | 34.54 | 3 |
| Sanlam Global Best Ideas | 29.28 | 4 |
| Sarasin Responsible Global Equity (Sterling Hedged) | 10.39 | 4 |
| Scottish Widows Opportunities Portfolio | 32.63 | 3 |
| SKAGEN Global | 25.67 | 4 |
| Stonehage Fleming Global Equities I | 25.01 | 4 |
| Stonehage Fleming Global Equities II | 31.64 | 3 |
| The 140 Investment Managers Broadway ICVC Balanced | 16.42 | 4 |
| TM UBS (UK) Global Equity | 29.80 | 4 |
| Waverton Tactical Equity | 23.90 | 4 |
| Sector average | 35.78 | |
| Global Bonds | ||
| Candriam Bonds Credit Opportunities | 12.14 | 3 |
| Candriam Bonds Total Return | 10.97 | 4 |
| CF Canlife Global High Yield Bond | 8.62 | 4 |
| GS Global High Yield Portfolio | 9.67 | 4 |
| JB BF Total Return | 3.42 | 4 |
| L&G Global Inflation Linked Bond Index | 7.74 | 4 |
| Legg Mason IF Western Asset Global Multi Strategy Bond | 9.65 | 4 |
| New Capital Global Value Credit | 8.65 | 4 |
| Pimco GIS Euro Bond | 17.85 | 3 |
| Pimco GIS Euro Low Duration | 4.27 | 4 |
| Pimco GIS Euro Short-Term | 2.28 | 4 |
| Templeton Emerging Markets Bond | 2.61 | 4 |
| Templeton Global Bond | 2.90 | 4 |
| Templeton Global Total Return Bond | 1.39 | 4 |
| The 140 Investment Managers Broadway ICVC Income | 7.79 | 4 |
| Sector average | 21.25 | |
| Global Emerging Market Bond | ||
| Aviva Investors Emerging Markets Local Currency Bond | 12.38 | 3 |
| Candriam Bonds Emerging Debt Local Currencies | 15.90 | 3 |
| Investec Emerging Markets Local Currency Debt | 14.05 | 3 |
| JB BF Emerging Markets Inflation Linked | -6.28 | 4 |
| JB BF Local Emerging | -8.31 | 4 |
| Natixis Loomis Sayles Emerging Debt & Currencies | -14.14 | 4 |
| Pimco GIS Emerging Markets Corporate Bond | 5.63 | 4 |
| Schroder ISF Emerging Market Local Currency Bond | 11.70 | 4 |
| Threadneedle Emerging Market Local | 12.33 | 4 |
| Sector average | 23.17 | |
| Global Emerging Markets | ||
| Capital Group Capital International Emerging Markets | 15.19 | 4 |
| Investec Emerging Markets Equity | 18.60 | 4 |
| Legg Mason QS Emerging Markets Equity | 14.66 | 4 |
| MFS Meridian Emerging Markets Equity | -4.71 | 4 |
| Newton Emerging Income | 15.20 | 4 |
| Threadneedle Global Emerging Market Equity | 17.36 | 4 |
| Vanguard Emerging Markets Stock Index | 23.59 | 3 |
| Sector average | 21.92 | |
| Global Equity Income | ||
| Davy Defensive Equity Income | 31.02 | 3 |
| Legg Mason IF Clearbridge Global Equity Income | 32.68 | 3 |
| Legg Mason IF Martin Currie Global Equity Income | 31.01 | 3 |
| Neptune Global Income | 20.93 | 4 |
| Sector average | 33.93 | |
| Japan | ||
| BlackRock GF Japan Flexible Equity | 36.66 | 4 |
| Cavendish Japan | 37.48 | 4 |
| JOHCM Japan | 36.43 | 4 |
| JPM Japan Select Equity | 32.08 | 4 |
| Legg Mason IF Martin Currie Japan Alpha | 29.94 | 4 |
| Polar Capital Japan | 34.97 | 4 |
| Polar Capital Japan Alpha | 33.27 | 4 |
| Threadneedle Japan | 36.10 | 4 |
| Threadneedle Japan Growth | 37.64 | 3 |
| Sector average | 43.82 | |
| Japanese Smaller Companies | ||
| BlackRock GF Japan Small & MidCap Opportunities | 51.39 | 3 |
| Sector average | 62.19 | |
| Mixed Investment 20%-60% Shares | ||
| BlackRock Global Multi Asset Income | 12.46 | 4 |
| TB Doherty Cautious Managed | 16.05 | 3 |
| FP Distinction Diversified Real Return | 1.69 | 4 |
| Invesco Perpetual Distribution | 11.39 | 4 |
| L&G Distribution Trust | 12.98 | 4 |
| L&G Multi Manager Income Trust | 15.16 | 4 |
| Margetts Providence Strategy | 14.97 | 4 |
| MGTS Frontier Cautious | 11.27 | 4 |
| MGTS Future Money Real Value | 13.72 | 4 |
| Scottish Widows HIFML Diversified Return | 6.45 | 4 |
| UBS Multi Asset Income | 5.50 | 4 |
| Sector average | 17.10 | |
| Mixed Investment 40%-85% Shares | ||
| Consistent Practical Investment | 16.81 | |
| TB Doherty Active Managed | 21.38 | 4 |
| Family Balanced International | 18.67 | 3 |
| FP Thoroughbred Core Alpha | 16.90 | 4 |
| L&G Multi Manager Balanced Trust | 16.34 | 4 |
| McInroy & Wood Income | 19.29 | 4 |
| Neptune Balanced | 18.17 | 4 |
| SVS Church House Balanced Equity Income | 17.20 | 4 |
| Thesis Libero Strategic | 19.00 | 4 |
| TM Fulcrum Diversified Growth | 3.04 | 4 |
| TM UBS (UK) UK Income Focus | 19.03 | 4 |
| Sector average | 21.56 | |
| North America | ||
| Aberdeen Global North American Equity | 46.41 | 4 |
| Aberdeen North American Equity | 48.97 | 4 |
| Candriam Sustainable North America | 51.88 | 4 |
| GAM Star Capital Appreciation US Equity | 35.01 | 4 |
| Legg Mason IF Martin Currie North American | 56.32 | 3 |
| Legg Mason Martin Currie North American | 51.41 | 4 |
| Legg Mason Opportunity | 40.80 | 4 |
| MFS Meridian US Value | 29.32 | 4 |
| Smith & Williamson North American Equity | 48.33 | 4 |
| Sector average | 58.20 | |
| North American Smaller Companies | ||
| JPM US Smaller Companies | 37.56 | 4 |
| Sector average | 57.03 | |
| Property | ||
| HC FCM Salamanca Global Property 1 | -39.83 | 4 |
| Host Capital UK Student Accommodation | 7.22 | 4 |
| Sector average | 29.20 | |
| Sterling Corporate Bond | ||
| Fidelity MoneyBuilder Income Reduced Duration | 4.49 | 4 |
| Halifax Corporate Bond | 16.16 | 4 |
| Legg Mason IF Western Asset Retirement Income Bond | 7.31 | 4 |
| M&G Global Corporate Bond | 12.45 | 4 |
| Premier Corporate Bond Monthly Income | 11.14 | 4 |
| Royal Bank of Scot Extra Income | 17.95 | 3 |
| Smith & Williamson Fixed Interest | 18.29 | 3 |
| TB Walker Crips Corporate Bond | 12.79 | 4 |
| Sector average | 19.46 | |
| Sterling High Yield | ||
| NB Short Duration High Yield Bond | 5.27 | 4 |
| Scottish Widows High Income Bond | 2.45 | 4 |
| Sector average | 10.67 | |
| Sterling Strategic Bond | ||
| Aberdeen World Opportunistic Bond | 8.36 | 4 |
| HL Multi Manager Strategic Bond | 12.05 | 3 |
| Invesco Perpetual Tactical Bond | 9.31 | 4 |
| JPM Strategic Bond | 5.63 | 4 |
| Kames Strategic Bond | 7.45 | 4 |
| M&G UK Inflation Linked Corporate Bond | 3.19 | 4 |
| Old Mutual Voyager Strategic Bond | 6.25 | 4 |
| Pimco GIS UK Low Duration | 5.41 | 4 |
| Pioneer SICAV Strategic Income | 9.63 | 3 |
| Standard Life Investments Strategic Bond | 9.46 | 4 |
| Sector average | 13.64 | |
| Technology & Telecoms | ||
| Fidelity Global Telecommunications | 30.08 | 4 |
| GAM Star Technology | 34.63 | 4 |
| MFM Techinvest Technology | 17.59 | 4 |
| Sector average | 51.30 | |
| UK All Companies | ||
| FP Matterley Equity | 5.32 | 4 |
| GAM MP UK Equity | 10.85 | 4 |
| Henderson UK Equity Income & Growth | 13.47 | 3 |
| HSBC Common Fund for Growth | 13.74 | 3 |
| HSBC UK Freestyle | 10.26 | 4 |
| Sanlam FOUR Active UK Equity | 0.71 | 4 |
| Sarasin Fund for Charities Thematic UK Equity (GBP) | 0.94 | 4 |
| Sarasin UK Equity | 1.90 | 4 |
| Schroder UK Opportunities | 0.54 | 4 |
| Standard Life TM UK Equity General | 9.06 | 4 |
| Thesis TM Cartesian UK Enhanced Alpha | -0.02 | 4 |
| Thesis TM Cartesian UK Opportunities | -1.36 | 4 |
| Sector average | 17.04 | |
| UK Equity & Bond Income | ||
| HSBC Monthly Income | 15.58 | 4 |
| Sector average | 19.01 | |
| UK Equity Income | ||
| Allianz UK Equity Income | 11.67 | 4 |
| HC KB Enterprise Equity Income | 13.33 | 4 |
| HSBC Income | 12.28 | 4 |
| QAM Downing Monthly Income | 10.74 | 4 |
| Royal Bank of Scot Equity Income | 17.70 | 3 |
| Schroder UK Alpha Income | 15.39 | 4 |
| Sector average | 19.39 | |
| UK Gilts | ||
| CF Canlife UK Government Bond | 19.07 | 4 |
| HSBC Gilt & Fixed Interest | 21.33 | 4 |
| Schroder Gilt & Fixed Interest | 22.55 | 3 |
| Scottish Widows Gilt | 19.87 | 4 |
| Sector average | 26.97 | |
| UK Index Linked Gilts | ||
| Scottish Widows UK Index Linked Tracker | 44.37 | 4 |
| Sector average | 47.15 | |
| UK Smaller Companies | ||
| Aberdeen UK Smaller Companies Equity | 12.17 | 4 |
| Aberforth UK Small Companies | 15.65 | 3 |
| Aviva Inv UK Smaller Companies | 12.62 | 4 |
| Halifax Smaller Companies | 7.21 | 4 |
| Investec UK Smaller Companies | 9.46 | 4 |
| Scottish Widows UK Smaller Companies | 6.41 | 4 |
| SF Webb Capital Smaller Companies Growth | -31.37 | 4 |
| Sector average | 21.80 |
And here's the DropZone:
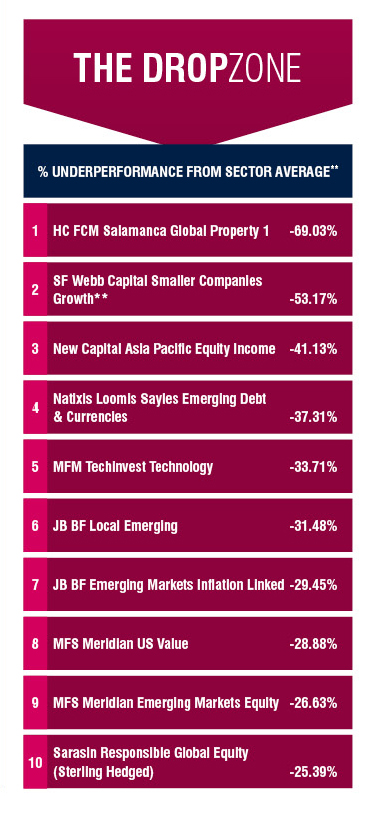
** Based on three-year cumulative performance. All data sourced from FEAnalytics.